The Item 19 Disclosure Score
How Do You Score a Franchise System?
Item 19 is where a franchisor can report financial performance. What do the numbers say about franchisee performance?
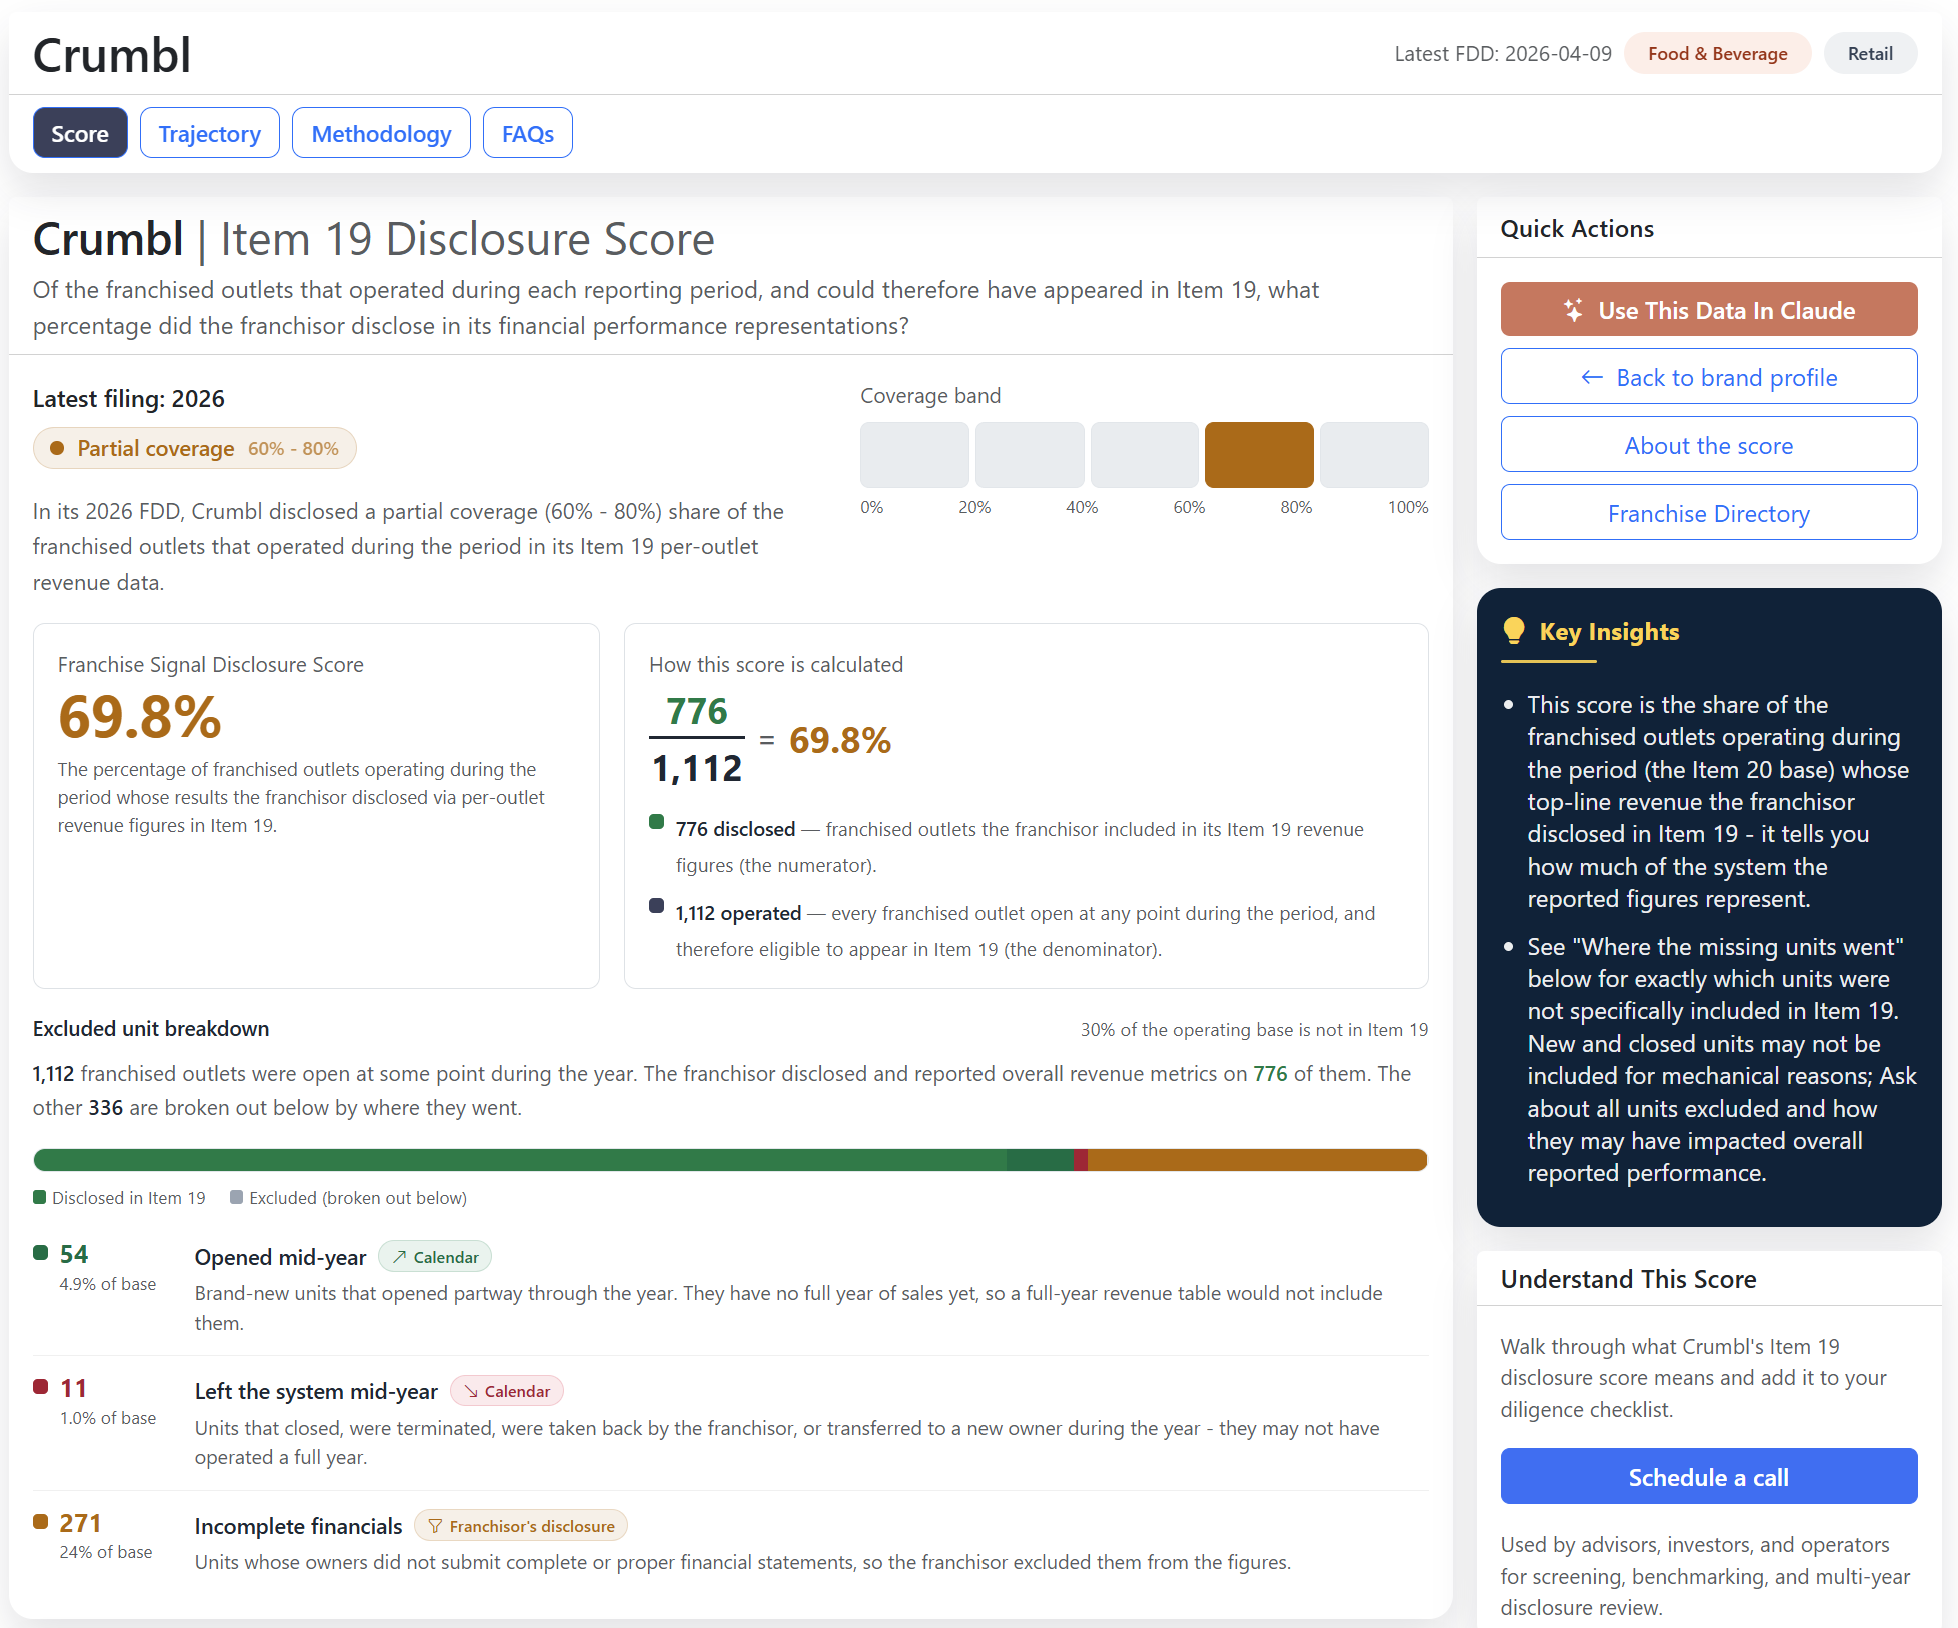
The Franchise Signal Disclosure Score combines item 19 and item 20 into a single disclosure score: the percentage of franchised outlets that were open at any part of the year and are disclosed in the per-outlet revenue figures the franchisor reports. This is a disclosure measure, not a business-quality grade - but the score gives important insight into diligence considerations.
Brand Scores Broken Down
The same scoring methodology produces different ranges depending on how much of the system a franchisor chose to disclose. Each example below links to its live score.
Producing a single score is a challenging problem for many reasons:
- Case specific business models - a bakery, a plumbing business, and a gym all have very different models, unit economics, and requirements.
- Location and Market - the same business could perform well in a specific region or local area, but struggle nationally. An FDD will not tell you how saturated your local market is.
- Operator Profile - have you worked as a plumber for years and are now looking to open your own service business? Or have you worked an unrelated corporate role for the last ten years?
At the end of the day - if you are considering starting a business there are many factors to consider.
A franchise is a specific business ownership model.
Proponents of the franchise model may claim that you get a "proven playbook" and therefore increase your chances of success. Is this true for your situation?
What about all of the other considerations of a franchise...
- Should you lock yourself into a 10-year contract and take on all downside risk?
- Is bad news able to escape the system and reach you in your evaluation... or does tension in a system never make it to litigation because of high expenses and arbitration clauses (and is therefore not disclosed in Item 3)?
- Are operators who may want out of a system "stuck" because of liquidated damage clauses?
If a system is so "proven" and "profitable"... why are you so lucky to receive this opportunity? Why is a brand willing to (in many cases) pay tens of thousands of dollars to a broker or rep to sell you into investing your time and capital into a system that the brand knows more about than you do? Why is the brand not opening this new location themselves?
In other words... what is your "edge"?
Your job in diligence is to figure out answers to all of these questions. (Full plug here - if you don't know what these terms all mean - you should. And we offer a paid diligence package plan).
In creating a scoring system we looked at many metrics for consideration...
- How much has the initial investment increased over time?
- How are royalties structured?
- How many units have opened and closed?
- What kind of leadership changes are present?
- How have key contract clauses changed over time?
All of these are critical parts of diligence - and Franchise Signal helps you review them for any brand.
But... for a single score we wanted something that is:
What we developed is the Franchise Signal Disclosure Score.
It is relatively simple (although quite complex technically)... and it is:
Of all of the franchised units that operated during any part of the filing year... what percentage did the franchisor include and provide revenue based outlet metrics on in its FDD?
In other words, if there were 10 franchised outlets that operated at any point during the year, and the franchisor provided top line revenue metrics for 9 units (and excluded one for "late submitted financials") - this would be a 90% score.
This is the easy example, but Item 19's get complex.
Some franchises break out quartiles, quintiles, job averages, and other metrics. Some group together multiple units a franchisee may have. Some provide affiliate revenue only.
But how many franchised units are included in revenue figures?
And more importantly and left as an exercise for you as the reader is... why is this not 100%?
Franchises make money on royalties. So in order to collect royalties, a franchisor tracks sales for every franchised outlet.
Wouldn't all of the data exist? (Keep in mind that franchisors are also required to submit their financials as a part of Item 21...)
So why would a franchisor not report on every outlet (whether it opened, closed, transferred, "reported late", or was otherwise excluded)?
If a unit exceeded all averages and median figures, would a brand want to showcase and include it? What does the opposite imply?
Most importantly... you are considering investing hundreds of thousands of dollars and signing a ~10 year contract with potential personal guarantees. Should you have 100% of the reported financial performance?
The Franchise Signal disclosure score is designed to help you bridge that gap and aid in your diligence so that you can take any questions back to your drawing board.

How is the Score Measured?
The score is a ratio, measured the same way for every brand and filing year.
The challenge is extracting and filtering the numerator, because not everything a franchisor discloses in Item 19 is per-outlet revenue.
A dollars-per-outlet revenue figure tied to a stated number of franchised outlets. An average across a set of outlets discloses revenue for every outlet in that set, so the count behind the average is what we credit.
Metrics that are not per-outlet revenue: sales per job or per transaction, jobs or transactions per day, recurring-customer rates, or cost ratios. These other metrics may be helpful, but they are not a direct statement about an outlet's annual revenue.
Why Does this Score Matter to You?
A franchisor typically earns a royalty on each franchised outlet's revenue, which means they tend to already hold the numbers for the whole system. When an outlet is not included in Item 19, fair questions are "why was a figure they likely already have left out?" and "how might that omission affect the average and median revenue figures they do report?"
The reported figures reflect more of the full system, so the averages and medians you might underwrite against are harder to cherry-pick. A system with stable growth and low churn may score higher.
The headline financial performance representations are based on a narrower slice of the full system. The numbers may be accurate, but describe a smaller part of the system you are considering investing into. Consider asking about these numbers on a franchisee validation call.
This is a disclosure-breadth measure of top-line revenue coverage. It is not a measure of profitability, returns, or whether a brand is a good investment. A brand can disclose broadly and still be a difficult business, or disclose narrowly and run strong units. The score speaks mainly to how much of the picture you are being shown in Item 19.
See Full Scores, Disclosure Breakdown, and Trajectory
Every scored brand page leads with the calculated percentage and bucket, then breaks the gap down on any unreported outlets.
How to Read the Coverage Bands
Every scored filing lands in one of three color bands on a five-segment gauge. The same colors appear on each brand page, so the band is readable at a glance before you look at the exact percentage.
What a Rising or Falling Score may Suggest
We score every available filing year, so each brand has a trajectory rather than a single snapshot. The direction can also be informative as its own trend and score.
Coverage widening year over year often tracks a maturing system, as more units complete full years and provide a larger base. Recent figures tend to describe more of what a buyer would be stepping into.
Coverage narrowing while a system grows can be worth a closer look. If the denominator grew but the disclosed slice did not keep pace, the headline may now speak for a smaller share than before.
- Rapid openings. A brand opening units quickly carries many outlets with no full year of revenue yet. A full-year-only table may not include them, so strong averages can rest on a small, mature core while much of the system stays out of view.
- Closures and churn. Units that closed or transferred still operated during the year and still had performance. We specifically include these outlets in the denominator to avoid filtering out locations that may have been excluded and had potentially less revenue and/or profits than other units disclosed.
Handling Various Edge Cases
Item 19 coverage can be affected by a number of factors, including the age of the system, the pace of openings and closures, and the presence of non-disclosed units. The following examples illustrate how these factors can influence the coverage score.
The figures shown may well be accurate, but they describe a fraction of the system. The Franchise Signal score break down the coverage gap into newly opened units, units that left mid-year, and units set aside for a stated reason. This breakdown buckets "why" a score may be low (based on the details of what is disclosed in Item 19 footnotes).
A franchised base operated during the year and the disclosed figures cover only affiliate or company-owned results. Company-run and affiliate-run economics may differ from what a franchisee experiences and often take years to run to see the unit economics and mature profile. We specifically exclude affiliate units for these reasons.
0% is a measured finding: a base operated and none of it was shown. Not applicable means there was nothing to measure. A result may be n/a when:
- - The filing made no Item 19 representation at all.
- - No franchised outlet had completed the period yet, as in a true first-year system.
Not applicable may also apply when a disclosed base does not line up specifically with a per-unit conversion. For example, some systems may report revenue by franchisee, but franchisees may own multiple units. The conversion may not be determinisitcally possible for a true per-outlet revenue median and average.
See a full score and filing history: Crumbl
The full Crumbl disclosure score is unlocked and available across multiple filing years, with no account required. Walk the trajectory from the earliest filing forward, read the breakdown beneath the Franchise Signal score, and see how the same elements described on this page render against Item 19 and Item 20 data.
Run this Analysis on a Brand You are Considering
Crumbl is a free unlocked score and trajectory. When you are weighing a specific franchise opportunity, there are three ways to use this analysis.
Get FDD Access for a brand to reveal its exact coverage, every filing year, and the full excluded-unit breakdown. If a brand or filing year has not been computed yet, unlocking runs the pipeline and the result is typically ready in about 15 minutes.
Pull the structured score, Item 19 populations, and Item 20 movement (along with other FDD sections) for any unlocked brand-year into Claude through the Franchise Signal connector, and build the comparison into a diligence memo or pro-forma.
Book a short intro call to scope an FDD diligence workspace around the brands you are weighing, with the score, delta reporting, and MCP workflows set up for how you research.
The Item 19 Disclosure Score measures disclosure breadth only. It is neutral and reproducible from the source FDD, but it is not a recommendation and does not represent business quality, profitability, or franchise performance. Franchise Signal is an independent research platform, not affiliated with or endorsed by any franchisor, and does not provide legal, financial, tax, investment, or franchise purchase advice. Franchise Signal can make mistakes. Always verify against the current FDD and consult qualified professionals for decision-making.