For Franchise Research

Research franchise opportunities with FDD-backed analytics, sector comparisons, and structured diligence workflows.

Franchise Diligence

You may have chatted with a broker, attended a conference, or started your online research. How do you know what franchises are available? What should you consider as you research opportunities?

Buying or starting a franchise is typically a $100K+ investment and time commitment. Franchise contracts can be ten years, and require personal guaruantees on SBA financing, lease obligations, and more. Understand the upside, playbooks, training, and franchisor assistance - in addition to downside risks, royalty minimums, any liquidated damages, and performance standards.

Franchise Signal is built for diligence. It is *NOT* meant to replace any conversations you *should* be having with advisors, attorneys, other franchisees, or your network.

Rather, Franchise Signal is designed to help in your top of funnel research - use it to source FDDs, review key disclosure items and clauses, compare brands in context, and understand what changed in an FDD year over year. And then come back as you test your assumptions, validate with franchisees, and have conversations with franchisee attorneys and independent advisors.

Use Franchise Signal's structured data to help address various topics and grounded FDD disclosure data for Natural Language processing and as topics to consider for your validation calls, attorney conversations, and franchisor meetings.

Help Drive Your Diligence Workflows
What initial investment is needed to open this franchise?
What fees and minimum royalties are in place? Has this increased or changed over time?
What financials are presented in Item 19? How many units were included?
How does this concept compare to similar brands in the sector?
Franchise Signal is built to make these questions easier to answer with structured, FDD-backed context.
Item 7 / Initial Investment
Working capital assumptions can often be optimistic. Understand investment ranges and what is expected up front.
Item 19 / Financial Performance
Revenue numbers can be selective and corporate territories or locations can vary. See what numbers are presented and compare ranges, medians, and averages.
Item 20 / Outlet Growth
Net growth can hide churn, closures, and reacquisitions. Track openings versus exits and what it means.
Item 3 / Litigation
A lagging indicator of stress points. Understand patterns and triangulate with other data points.

Understand The Incentives Of Your Franchise Buying Process

The YouTube video you watched, the independent content creator, the broker you spoke with, and the franchise marketing site you reviewed are all designed to sell you on the brand.

There is nothing inherently wrong with this, but you should understand each party's incentive structure.

Marketing is designed to sell, not to serve as primary diligence.
Brokers and advisors are typically compensated when a deal closes.
Revenue claims can be framed selectively within the rules.
Outlet growth totals can mask churn, closures, and terminations.

Franchise Signal is built to keep diligence grounded in FDD data throughout the process.

An FDD does not read like a book. Items 1 through 23, exhibits, and financial tables all connect. The goal is to build a clear narrative around risk, working capital, unit performance, contract terms, and what could matter on the downside, not just on the sales call.

Zoom Out Before You Zoom In

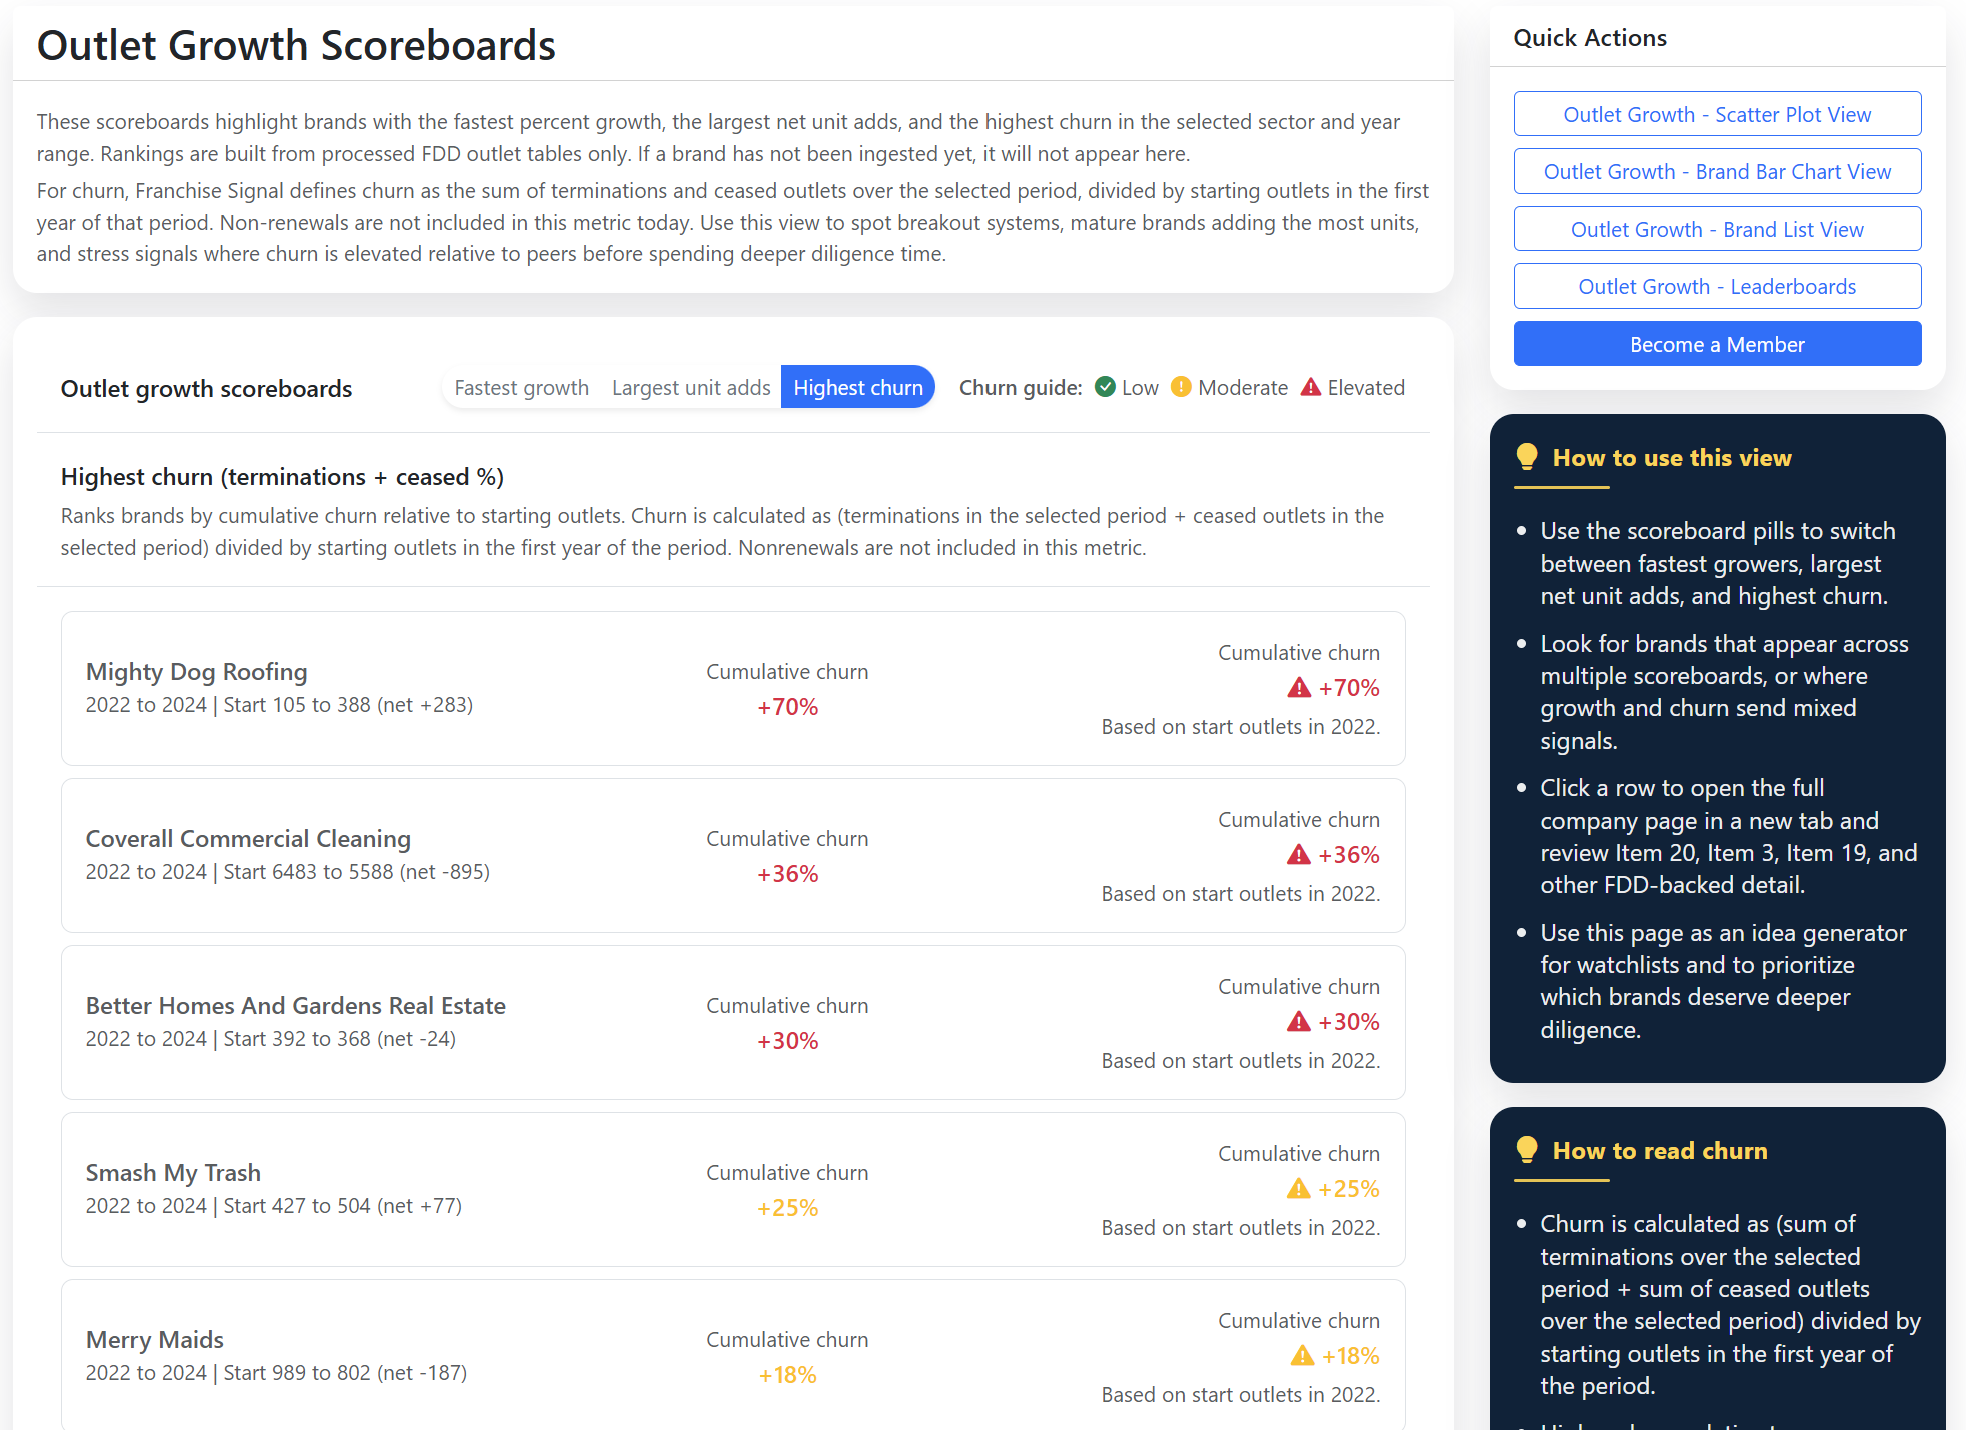
Brand level stats are easier to interpret when you understand the surrounding sector. Franchise Signal Analytics provides outlet growth and churn dashboards for brands and categories, based on the latest FDD data.

Home services: aggressive growth in new outlets can mean higher customer acquisition costs and local competition.
Fitness and recreation: emerging categories like pickleball and hybrid fitness are growing quickly, while unit economics are still normalizing.
Food and beverage: niche concepts face questions around recurrence, ticket size, and category saturation.
Brand Outlet Count, Growth, And Churn
2025 FDDs (2024 calendar year data)
Franchise outlet growth and churn analytics example
Quickly see which brands are adding outlets, where churn is concentrated, and how your short list compares.

Built For Prospective Operators and Diligence First Workflows

Franchise Signal keeps your diligence loop anchored on FDD data and cross brand comparability.

Browse Franchises
FDD-backed answers
Ask questions and get grounded responses tied to the actual document, not marketing summaries.
Item-level interpretation
Built in context for Item 7, Item 19, Item 20, Item 3, and related sections so you know what to review more closely.
Side-by-side comparisons
Compare fees, investment ranges, financial disclosures, and outlet trends across brands instead of reviewing one concept in isolation.
Sector trend snapshots
Zoom out before you zoom in to understand broader growth, churn, and saturation patterns across a category.