A Franchise Signal research report based on Crumbl Franchising LLC's 2026 Franchise Disclosure Document. This report covers store revenue disclosures, startup costs, franchise agreement terms, system growth data, lawsuits, and the franchisor's financial statements.
Research Report
Crumbl: A Case Study in Franchise Diligence (2026 FDD)
Crumbl Franchising, LLC facilitates franchising of Crumbl restaurants (cookie baking and dessert business).

Executive Summary
Key findings from the Crumbl 2026 and 2025 FDD filings. All figures are taken directly from the FDD or calculated from figures it discloses.
Item 19Financial Performance
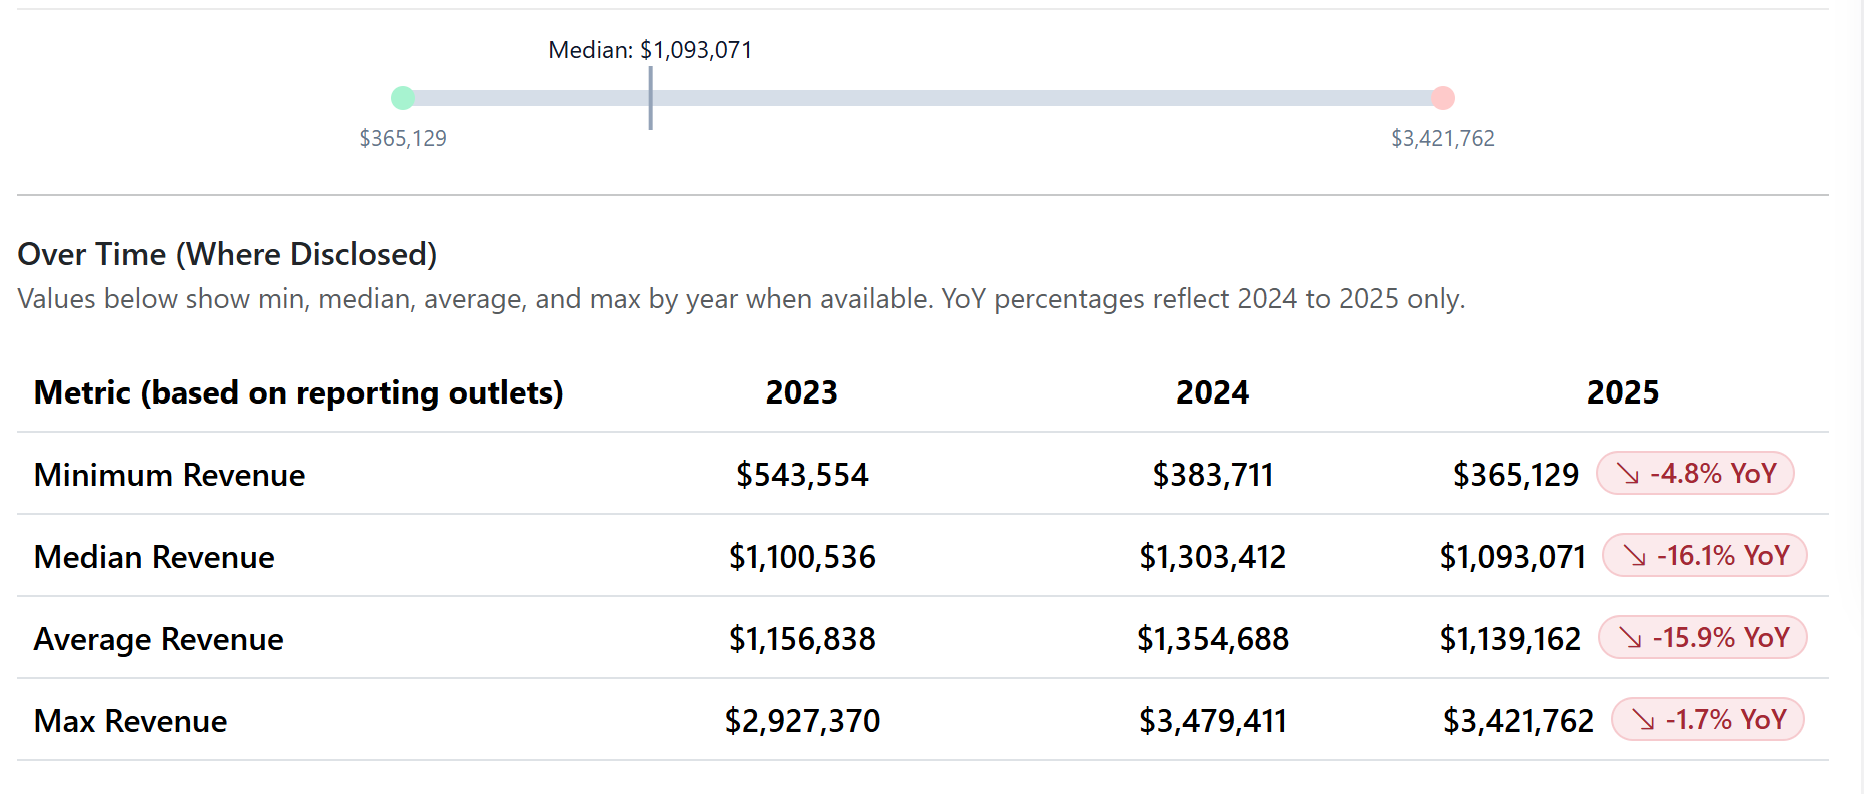
Every reported revenue metric declined year-over-year. Profit data disclosed in the 2025 filing has been removed from the 2026 FDD.
Median annual store revenue fell from $1,303,412 in FY 2024 to $1,093,071 in FY 2025, a YoY decline of 16.1%. Average, minimum, and maximum also declined. Last year's FDD included average and median net profit per store. This year's FDD discloses gross revenue only.
Item 19 Coverage
74% of eligible locations are included in the Item 19 revenue disclosures, down from 81% reporting in the prior year.
Of 1,048 locations that operated through all of 2025, 776 are included in the Item 19 revenue disclosures. The franchisor collectes royalties based on revenue weekly. The excluded locations' revenue is not disclosed. No issues with royalty revenue collection mentioned in Item 21 franchisor audited financial statements.
Item 7Startup Costs
The estimated cost to open a location increased ~34% from the 2024 disclosures (based on the midpoint range), while reported store revenue fell.
Item 7 now estimates total startup costs at $848,566 to $1,472,533 per location. The midpoint has increased roughly 34% compared to the 2024 FDD. Over that same period, median store revenue decreased from $1,100,536 to $1,093,071.
Related-party TransactionsItem 21
A management fee paid to the parent company grew from zero in 2022 to $60.3 million in 2025. The filing does not describe what services it covers.
Starting in 2023, Crumbl Franchising began paying a management fee to its parent, Crumbl Enterprises LLC. The fee was $24.3M in 2023, $30.7M in 2024, and $60.3M in 2025. In 2025, total revenue was $155.7M and net profit was $33.9M. The filing records the fee in general and administrative expenses and identifies it as a management fee paid to Crumbl Enterprises LLC. It does not describe the services provided, the basis for the fee amount, or the reason for the increase from 2024 to 2025. The fee was not present in the 2022 financial statements. Footnotes also disclose that Crumbl Franchising licenses all intellectual property, including trademarks, recipes, and operating systems, from a related entity for a one-time fee of $100.
Item 3Litigation
Item 3 lists one lawsuit. The financial statements reference several legal proceedings with potential costs reaching $17.6M.
Item 3 discloses one pending case: Watson and Keers v. Crumbl LLC et al., a 2023 class action alleging that service fees were displayed and charged in a misleading way. Trial is scheduled for 2026. Financial statement footnotes separately disclose several other proceedings, including alleged copyright infringement and sales disputes, with potential costs ranging from $6,067,500 to $17,605,020. The company has set litigation accrual as the lowest number in that range.
Confidentiality
Some franchisees who have left the system may be restricted from discussing their experience.
The FDD states that certain current and former franchisees have signed confidentiality agreements. "During the last three fiscal years, franchisees have signed confidentiality clauses that restrict them from discussing with you their experiences as a franchisee in our franchise system. These primarily are former franchisees that have transferred their location and have signed our general release agreement, which contains a confidentiality clause."
Item 6Exit Terms
Leaving the system early can trigger a penalty equal to up to 36 months of royalty payments.
Crumbl outlines a liquidated damages clause stated at average monthly royalty from the prior 12 months multiplied by the lesser of 36 months or the remaining contract term. At the 2025 median reported store revenue of $1,093,071 and an 8% royalty rate, the implied average monthly royalty is approximately $7,287. At the maximum term of 36 months, the pre-discount exposure is approximately $262,332. This penalty covers lost royalties only and does not limit other damages the franchisor may pursue.
Quick Actions
Browse ResearchFranchise AnalyticsFranchise DirectoryBook a Connect Call
Use reports to identify signals, then validate with brand pages, sector context, and the latest disclosures.
Key Insights
- Every Item 19 revenue metric declined year-over-year. Profit data disclosed in prior year's filing has been removed from current year's filing.
- 74% of full year operational stores had revenue figures included in Item 19 disclosures.
- Management fees paid to the parent company grew from $0 in 2022 to $60.3M in 2025. The FDD does not say what this covers.
- Item 3 lists one lawsuit. Financial statement footnotes reference several proceedings with stated ranges potentially reaching $17.6M.
Disclosure
Franchise Signal is an independent research platform and is not affiliated with or endorsed by any franchisor or franchise system.
We do not provide lead generation and we are not brokers, agents, or investment or legal advisors.
If data looks incorrect or you have questions, please contact info@franchisesignal.com.
We do not provide lead generation and we are not brokers, agents, or investment or legal advisors.
If data looks incorrect or you have questions, please contact info@franchisesignal.com.
Revenue and Performance Disclosures
What financial results did Crumbl report, and what changed from last year?
Item 19: Financial Performance Representations
Crumbl reports gross revenue for 776 locations that operated continuously through all of 2025 and submitted their financial reports on time. Every reported metric declined compared to last year.
-16.1%
Median Store Revenue, Year-Over-Year Change
776 of 1,048
Locations Included in Revenue Data
~74%
Share of Eligible Locations Reporting
Crumbl locations year-over-year revenue trends
Of the 1,048 locations that ran continuously through all of 2025, 776 appear in Item 19. The FDD states that 325 additional locations were excluded because they either did not operate the full year or did not submit their reports by the filing deadline. The franchisor collected royalties from all locations weekly throughout the year. The revenue those excluded locations generated is not disclosed. In the prior year, 81% of eligible locations were included. That rate dropped to 74% in a year when every reported revenue figure also declined.
This year's Item 19 shows gross revenue only. Last year's FDD also disclosed average and median net profit per store. Those profit figures were removed. The FDD states that the revenue numbers shown do not include the costs a franchisee must subtract to find profit. Food, labor, rent, owner pay, royalties, technology fees, marketing fees, and loan payments are not part of Item 19. A prospective buyer reading Item 19 alone cannot determine what a typical Crumbl location earns after expenses.
The gap between the best and worst reporting locations is roughly 9x, from $365,129 to $3,421,762 in annual gross revenue. Item 19 does not explain what drives that difference. Location, market size, store age, and local competition are factors the FDD does not address in this section.
There is an independent way to check the Item 19 figures using the financial statements in Item 21. Crumbl reported $99,087,273 in royalty revenue for 2025. At the disclosed 8% royalty rate, that implies total system-wide gross revenue of roughly $1.24 billion. Divided by approximately 1,080 operating locations for the year, the implied average revenue per location is about $1,147,000, consistent with the $1,139,162 average in Item 19. This does not provide insight on median, min, or max for the full distribution.
Key Insights
- Search Item 19 wording changes across filing years to spot disclosure shifts.
- Benchmark Item 19 reporting coverage against other franchise brands.
- Compare store revenue trends to new openings and closures in one view.
- Flag disclosure changes for futher drill down and query.
Startup Costs and Ongoing Fees
How much does it cost to open a Crumbl location, and what do you pay the franchisor on an ongoing basis?
Items 5, 6, and 7: Fees and Estimated Startup Costs
8%
Weekly Royalty Fee (% of Gross Revenue)
2%
Advertising and Marketing Fee
$848K - $1.47M
Estimated Total Cost to Open
+34%
Cost-to-Open Midpoint Change Since 2024 FDD
Item 7 estimates the total cost to open a single Crumbl location at $848,566 to $1,472,533. The midpoint has increased roughly 34% compared to the 2024 FDD. Over that same period, median store revenue fell from $1,100,536 to $1,093,071. It costs more to open a location than it did two year ago, and the typical store is generating less revenue.
Key Insights
- Track Item 7 cost changes across filing years from the brand profile.
- Model total startup cost against disclosed revenue figures.
- Flag liquidated damage clauses and renewal conditions as items to review with an attorney.
System Growth and Store Activity
Is the Crumbl system growing, and how many locations have opened or closed in recent years?
Item 20: Outlet and Franchisee Information
+681%
Net Outlet Growth, 5-Year Period (2021 to 2025)
20.6%
Cumulative Churn, 5-Year Period (29 terminations / 141 starting outlets)
206
Franchise Agreements Signed, Locations Not Yet Open
99
New Locations Projected to Open Next Fiscal Year
| Year | Start | Opened | Terminations | Non-Renewals | Reacquired | Ceased | End | Net |
|---|---|---|---|---|---|---|---|---|
| 2021 | 141 | 184 | 0 | 0 | 0 | 0 | 325 | +184 |
| 2022 | 326 | 364 | 0 | 0 | 0 | 0 | 690 | +364 |
| 2023 | 690 | 288 | 7 | 0 | 1 | 0 | 970 | +280 |
| 2024 | 970 | 100 | 12 | 0 | 0 | 0 | 1,058 | +88 |
| 2025 | 1,058 | 54 | 10 | 1 | 0 | 0 | 1,101 | +43 |
The system grew from 141 locations at the start of 2021 to 1,101 at the end of 2025, a net increase of 681% over five years. That growth was not evenly distributed. New openings peaked at 364 in 2022 and 288 in 2023, then fell to 100 in 2024 and 54 in 2025. Terminations over the five-year period totaled 29, representing cumulative churn of 20.6% relative to the 141 locations operating at the start of the period.
Item 20 discloses that 206 franchise agreements have been signed for locations not yet open as of December 31, 2025, and that 99 new locations are projected to open in the next fiscal year. Outlet counts in this table reflect franchised outlets only and do not include affiliate or company-owned locations.
Item 20 includes a full list of current and former franchisees with contact information. Talking directly with people who operate or have recently left a Crumbl franchise is one of the most useful steps a prospective buyer can take. Some franchisees have signed confidentiality agreements that may limit what they can share.
Key Insights
- Compare new openings, closures, and net growth across years in the outlet activity view.
- Benchmark Crumbl growth against other brands in the same category.
- Use the Item 20 franchisee list as a starting point for direct outreach.
Lawsuits, Legal Exposure, and the Auditor Change
What legal matters are pending, and what changed when Crumbl switched accounting firms?
Items 3 and 21: Lawsuits, Litigation Accruals, and the New Auditor
1
Lawsuit Listed in Item 3 - Same Case Carried Across Both Filings
$6.1M
Litigation Accrual Booked in FY2025 - Floor of Disclosed Range
$17.6M
High End of FY2025 Disclosed Exposure Range
$6.4M
Cash on Hand at December 31, 2025
Item 3 of the 2025 FDD and Item 3 of the 2026 FDD each list one pending lawsuit: Watson and Keers v. Crumbl LLC et al., filed August 21, 2023. The plaintiffs allege that service fees were displayed and charged in a misleading way. Trial is scheduled for 2026. This is the same case carried forward across both filings. In both years, the FDD states that no additional matters are required to be disclosed in Item 3.
The financial statement footnotes in both filings describe a broader set of legal proceedings. Note 5 of the 2025 FDD audited financials (FY 2024), audited by Tanner LLC, discloses that the company is involved in several legal proceedings and estimates the potential cost at $12,650,000 to $35,415,000 as of December 31, 2024. Crumbl recorded $19,261,000 as the litigation accrual. Note 5 of the 2026 FDD audited financials (FY 2025), audited by Deloitte and Touche LLP, discloses several legal proceedings including alleged copyright infringement and sales disputes, with a potential cost range of $6,067,500 to $17,605,020 as of December 31, 2025. Crumbl recorded a litigation liability of $6,067,500, the precise floor of that range. In both years, one lawsuit appears in Item 3. In both years, the footnotes reference several proceedings with material potential costs.
A prospective buyer relying on Item 3 alone has an incomplete picture of legal exposure. Both filings disclose one lawsuit in Item 3 and several proceedings in the footnotes. The gap between those two disclosures is governed by different rules and produces a different picture of the company's legal risk depending on which section is read.
Key Insights
- Compare Item 3 litigation disclosures across multiple filing years.
- Cross-reference Item 3 with the financial statement footnotes to get the full picture.
- Track auditor changes and financial statement footnotes as part of your research.
The Franchisor's Finances
Is the company that runs the Crumbl franchise system in good financial shape?
Item 21: Financial Statements
Item 21 contains the audited financial statements for Crumbl Franchising LLC, the company franchisees sign their contracts with. It is a subsidiary of Crumbl Enterprises LLC. The Crumbl brand, including all trademarks, recipes, and operating systems, is held by a separate related entity and licensed to Crumbl Franchising LLC for a one-time fee of $100.
| Balance Sheet | 2023 | 2024 | 2025 |
|---|---|---|---|
| Total Assets | $32.2M | $39.6M | $25.8M |
| Total Liabilities | $46.1M | $63.1M | $42.7M |
| Member's Equity (Deficit) | ($13.9M) | ($23.4M) | ($16.9M) |
| Cash and Equivalents | $22.5M | $24.8M | $6.4M |
| Income and Cash | 2022 | 2023 | 2024 | 2025 |
|---|---|---|---|---|
| Revenue | $110.0M | $122.3M | $158.3M | $155.7M |
| Fee Paid to Parent Company | $0 | $24.3M | $30.7M | $60.3M |
| Net Income | $52.8M | $30.7M | $91.2M | $33.9M |
| Cash Generated from Operations | $57.3M | $48.3M | $103.6M | $28.2M |
| Member Distributions | $37.2M | $55.4M | $100.8M | $41.6M |
| Distributions as % of Net Profit | 70% | 180% | 111% | 123% |
Management fee paid to Crumbl Enterprises - 2022 to 2025
All figures from audited financial statements. Fee is recorded inside general and administrative expenses. Revenue and net income shown for scale.
2022
$0 fee
$52.8M net income
$110M revenue
690 locations
2023
$24.3M fee
$30.7M net income
$122.3M revenue
970 locations
2024
$30.7M fee
$91.2M net income
$158.3M revenue
1,058 locations
2025
$60.3M fee
$33.9M net income
$155.7M revenue
1,101 locations
RevenueNet incomeManagement fee
Crumbl Franchising LLC ended 2022 with 690 franchise locations, collected $110 million in revenue, and reported $52.8 million in net profit. There was no management fee. Starting in 2023, the company began paying a fee to its parent, Crumbl Enterprises LLC, described only as a fee for "management services." That fee was $24.3M in 2023, $30.7M in 2024, and $60.3M in 2025. Revenue was roughly flat between 2024 and 2025. The fee doubled. The filing does not describe what services were provided, how the amount was set, or why it increased.
The financial statement footnotes separately disclose that one related company accounted for 49% of Crumbl Franchising's total spending in 2025, up from 29% in 2024. The vendor is not named in this part of the filing. When you compare the $60.3M management fee against $122M in total operating expenses, the math produces 49.4%. The parent company both sets the fee and receives it. The filing makes no reference to the details of services.
For additional context: Crumbl Franchising licenses the entire Crumbl brand from a related entity for a one-time payment of $100. As they specifically state "The Company licenses certain intellectual property for use in association with restaurant services and products, trademarks, trade names, service marks, logos, commercial symbols, slogans, and derivatives thereof, along with certain recipes, mixes, formulas, copyrights, methods,systems, trade dress, proprietary know-how, operations, trade secrets, confidential information, relationships and other intellectual property and derivative products from a related entity that is wholly owned by Crumbl Enterprises for a one-time fee of $100."
This separation is important to call out. As a franchisee, you pay royalties to and have a franchise agreement with Crumbl Franchising. But it is a separate related entity that owns the brand and IP.
Member distributions vs. net income and cash from operations - 2023 to 2025
Member distributions are payments to the founders and equity holders of Crumbl Franchising LLC. These are not franchisees. In two of these three years, member distributions exceeded the cash the business generated from operations. In all three years, member distributions exceeded reported net income.
2023
$30.7M net income
$48.3M cash from operations
$55.4M distributed to membersexceeds cash from operations
2024
$91.2M net income
$103.6M cash from operations
$100.8M distributed to members
2025
$33.9M net income
$28.2M cash from operations
$41.6M distributed to membersexceeds cash from operations
Net profitCash from operationsMember distributions (exceeds cash from operations)
The company's member's equity has been negative in each of the three years shown in the current filing. Member distributions are payments made to the members of Crumbl Franchising LLC, which are the founders and equity holders of the franchisor entity, not franchisees. In 2023 and 2025, those distributions exceeded the cash the business generated from operations. In all three years, distributions exceeded reported net profit. In 2025, the business generated $28.2M in cash from operations and distributed $41.6M to its members. Cash on hand fell from $24.8M to $6.4M. The company that franchisees sign their contracts with ended 2025 with $6.4M in cash and negative member's equity.
Key Insights
- Search royalty revenue, member distributions, and cash position across filing years.
- Compare related-party transaction disclosures year over year.
- Track cash distributed to members against cash the business generated.
- Use this section to understand who you are entering a long-term contract with.
What This Document Does Not Answer
What are the key questions a prospective franchisee cannot answer from this filing alone?
The following questions come from reading this FDD and its financial statements. They are questions the document raises but does not answer. They are worth resolving before signing anything.
- What does a Crumbl location earn after all expenses? Item 19 discloses gross sales only. Food, labor, rent, royalties, technology fees, marketing fees, debt service, and owner compensation are not included. The 2025 FDD included average and median net profit per location. The 2026 FDD does not.
- What did the 325 locations excluded from Item 19 earn? The franchisor collected royalties from those locations weekly throughout 2025. Their revenue is not disclosed. The share of eligible locations excluded from Item 19 increased from 19% to 26% in the same year all reported revenue figures declined.
- Why is there a 9x range between low and high location revenue? No disclosures are made as to store size, territory, operator experience, store age, or other factors.
- What does the $60.3 million management fee cover? The filing identifies the fee, states it is paid to Crumbl Enterprises LLC for management services, and records it in general and administrative expenses. It does not describe the services provided, the basis for the fee amount, or the reason it increased from $30.7 million in 2024 to $60.3 million in 2025. The fee was not present in the 2022 financial statements.
- What are the legal proceedings referenced in the financial statement footnotes? Item 3 discloses one pending matter. Note 5 of the audited financial statements references several legal proceedings across multiple categories, with a potential cost range of $6,067,500 to $17,605,020. The individual matters are not identified in the filing.
Key Insights
- Use this list as a starting checklist for any attorney or advisor review.
- Reach out to current and former franchisees using the Item 20 contact list.
- Compare unanswered questions across multiple brands and get a complete sector comparison.
Get the Analysis You Need
Apply this diligence framework across more brands.
Prospective Franchisees
Structured FDD analysis across hundreds of brands, including the franchisor's financial health, how informative each brand's Item 19 is, fee comparisons, and store opening and closing trends.
For FranchiseesFranchise Attorneys
Cross-section FDD analysis that identifies areas worth a closer look, applied systematically across your client work.
For AttorneysOperators and Buyers
Review startup costs, disclosures and YoY FDD changes, and franchisee and franchisor financials.
For OperatorsRequest a Demo
See how Franchise Signal structures FDD data, tracks year-over-year changes, and supports the diligence process across brands.
Book a DemoAll data in this report is sourced from Crumbl Franchising LLC's 2026 Franchise Disclosure Document, dated April 9, 2026, and the accompanying audited financial statements. This report is for informational purposes only and does not constitute legal, financial, or investment advice. All figures should be verified against the source document. Readers should consult independent legal and financial advisors before making any franchise investment decision.
Download the Crumbl FDDs: Crumbl Profile and FDD Library