Jamba

Latest FDD: 2026-03-31Food & BeverageRetail
Franchisor
JAMBA JUICE FRANCHISOR SPV LLC
Investment Range
$480,850 - $941,300
Jamba operates branded stores that offer a variety of fresh, blended-to-order smoothies, cold and hot beverages, fresh squeezed juices, and portable food items for snacks and meals, and its system includes Traditional, Non-Traditional, and Auntie Anne’s co-branded store formats.
#Smoothies#Cold Beverages#Hot Beverages#Fresh Squeezed Juices#Portable Food Items

Sector comparison snapshots
See sector analysis data
Outlet growth scatter plot
Sector growth and unit size
Outlet growth churn scoreboard
Outlet growth and churn scoreboard by sector
Outlet growth and churn bar chart
Outlet growth and churn by sector
FAQs

Many people start by asking, "Is Jamba a good franchise?" There is no single answer because it depends on your goals, your local market, and the agreements you are signing.

Start by zooming out. Evaluate the sector and your local market context: demand drivers, customer acquisition costs, competitive intensity, pricing power, labor constraints, and how similar operators perform outside of franchising. A useful baseline question is whether you would pursue the same business without a franchise.

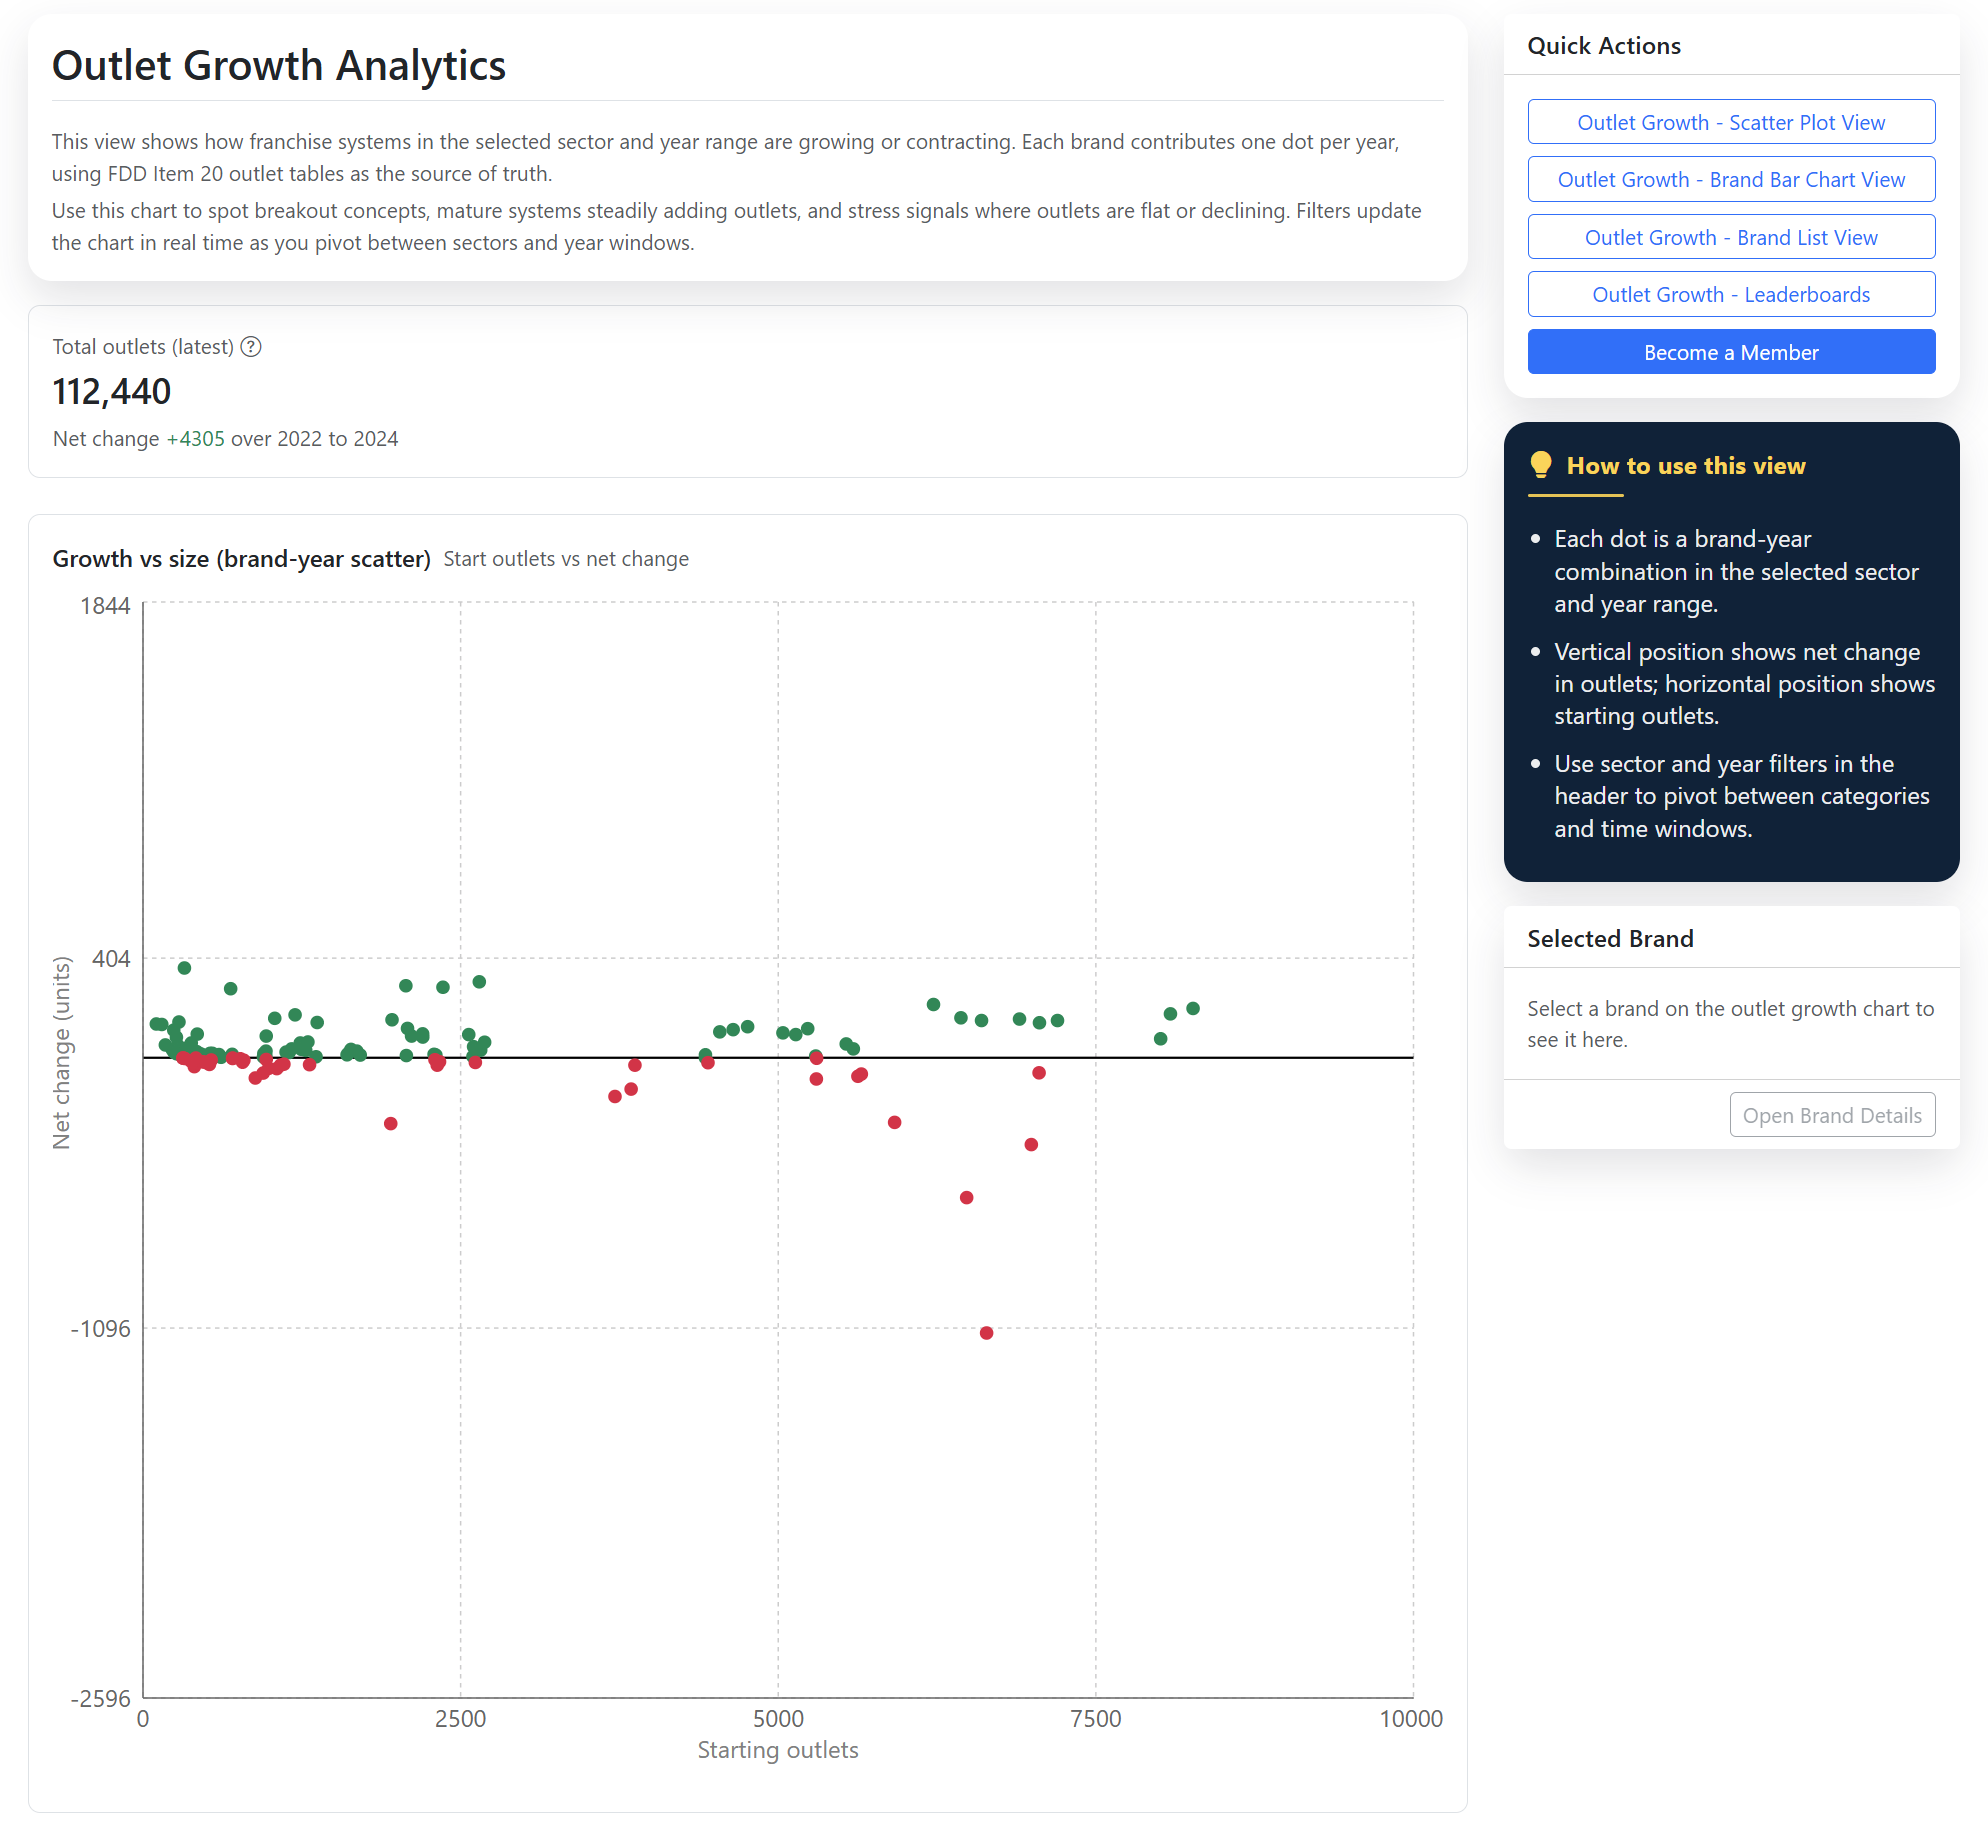
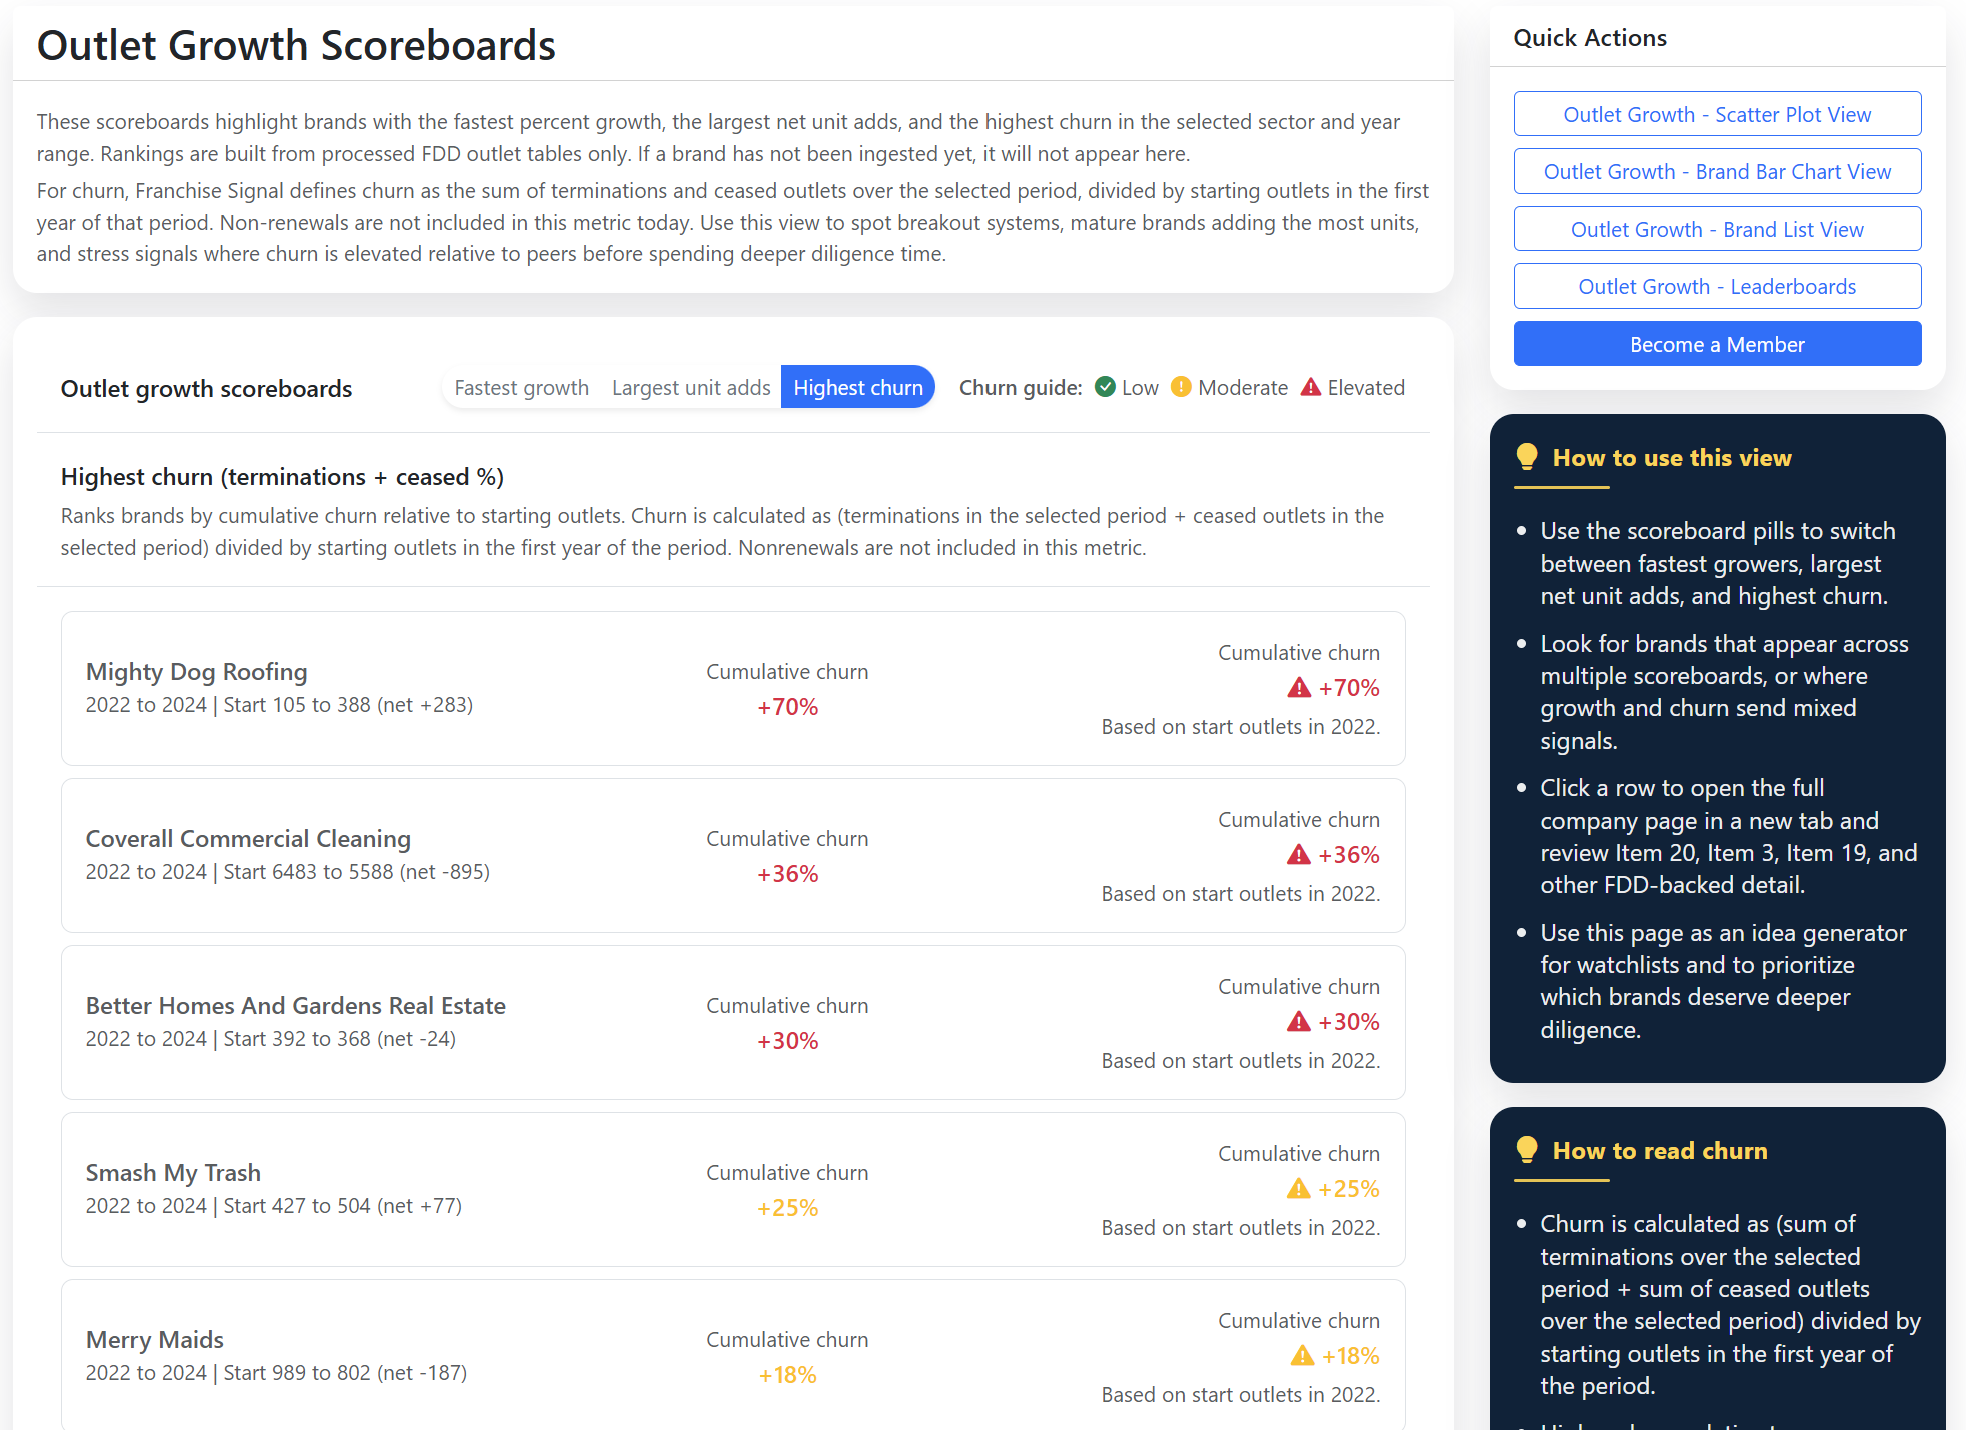
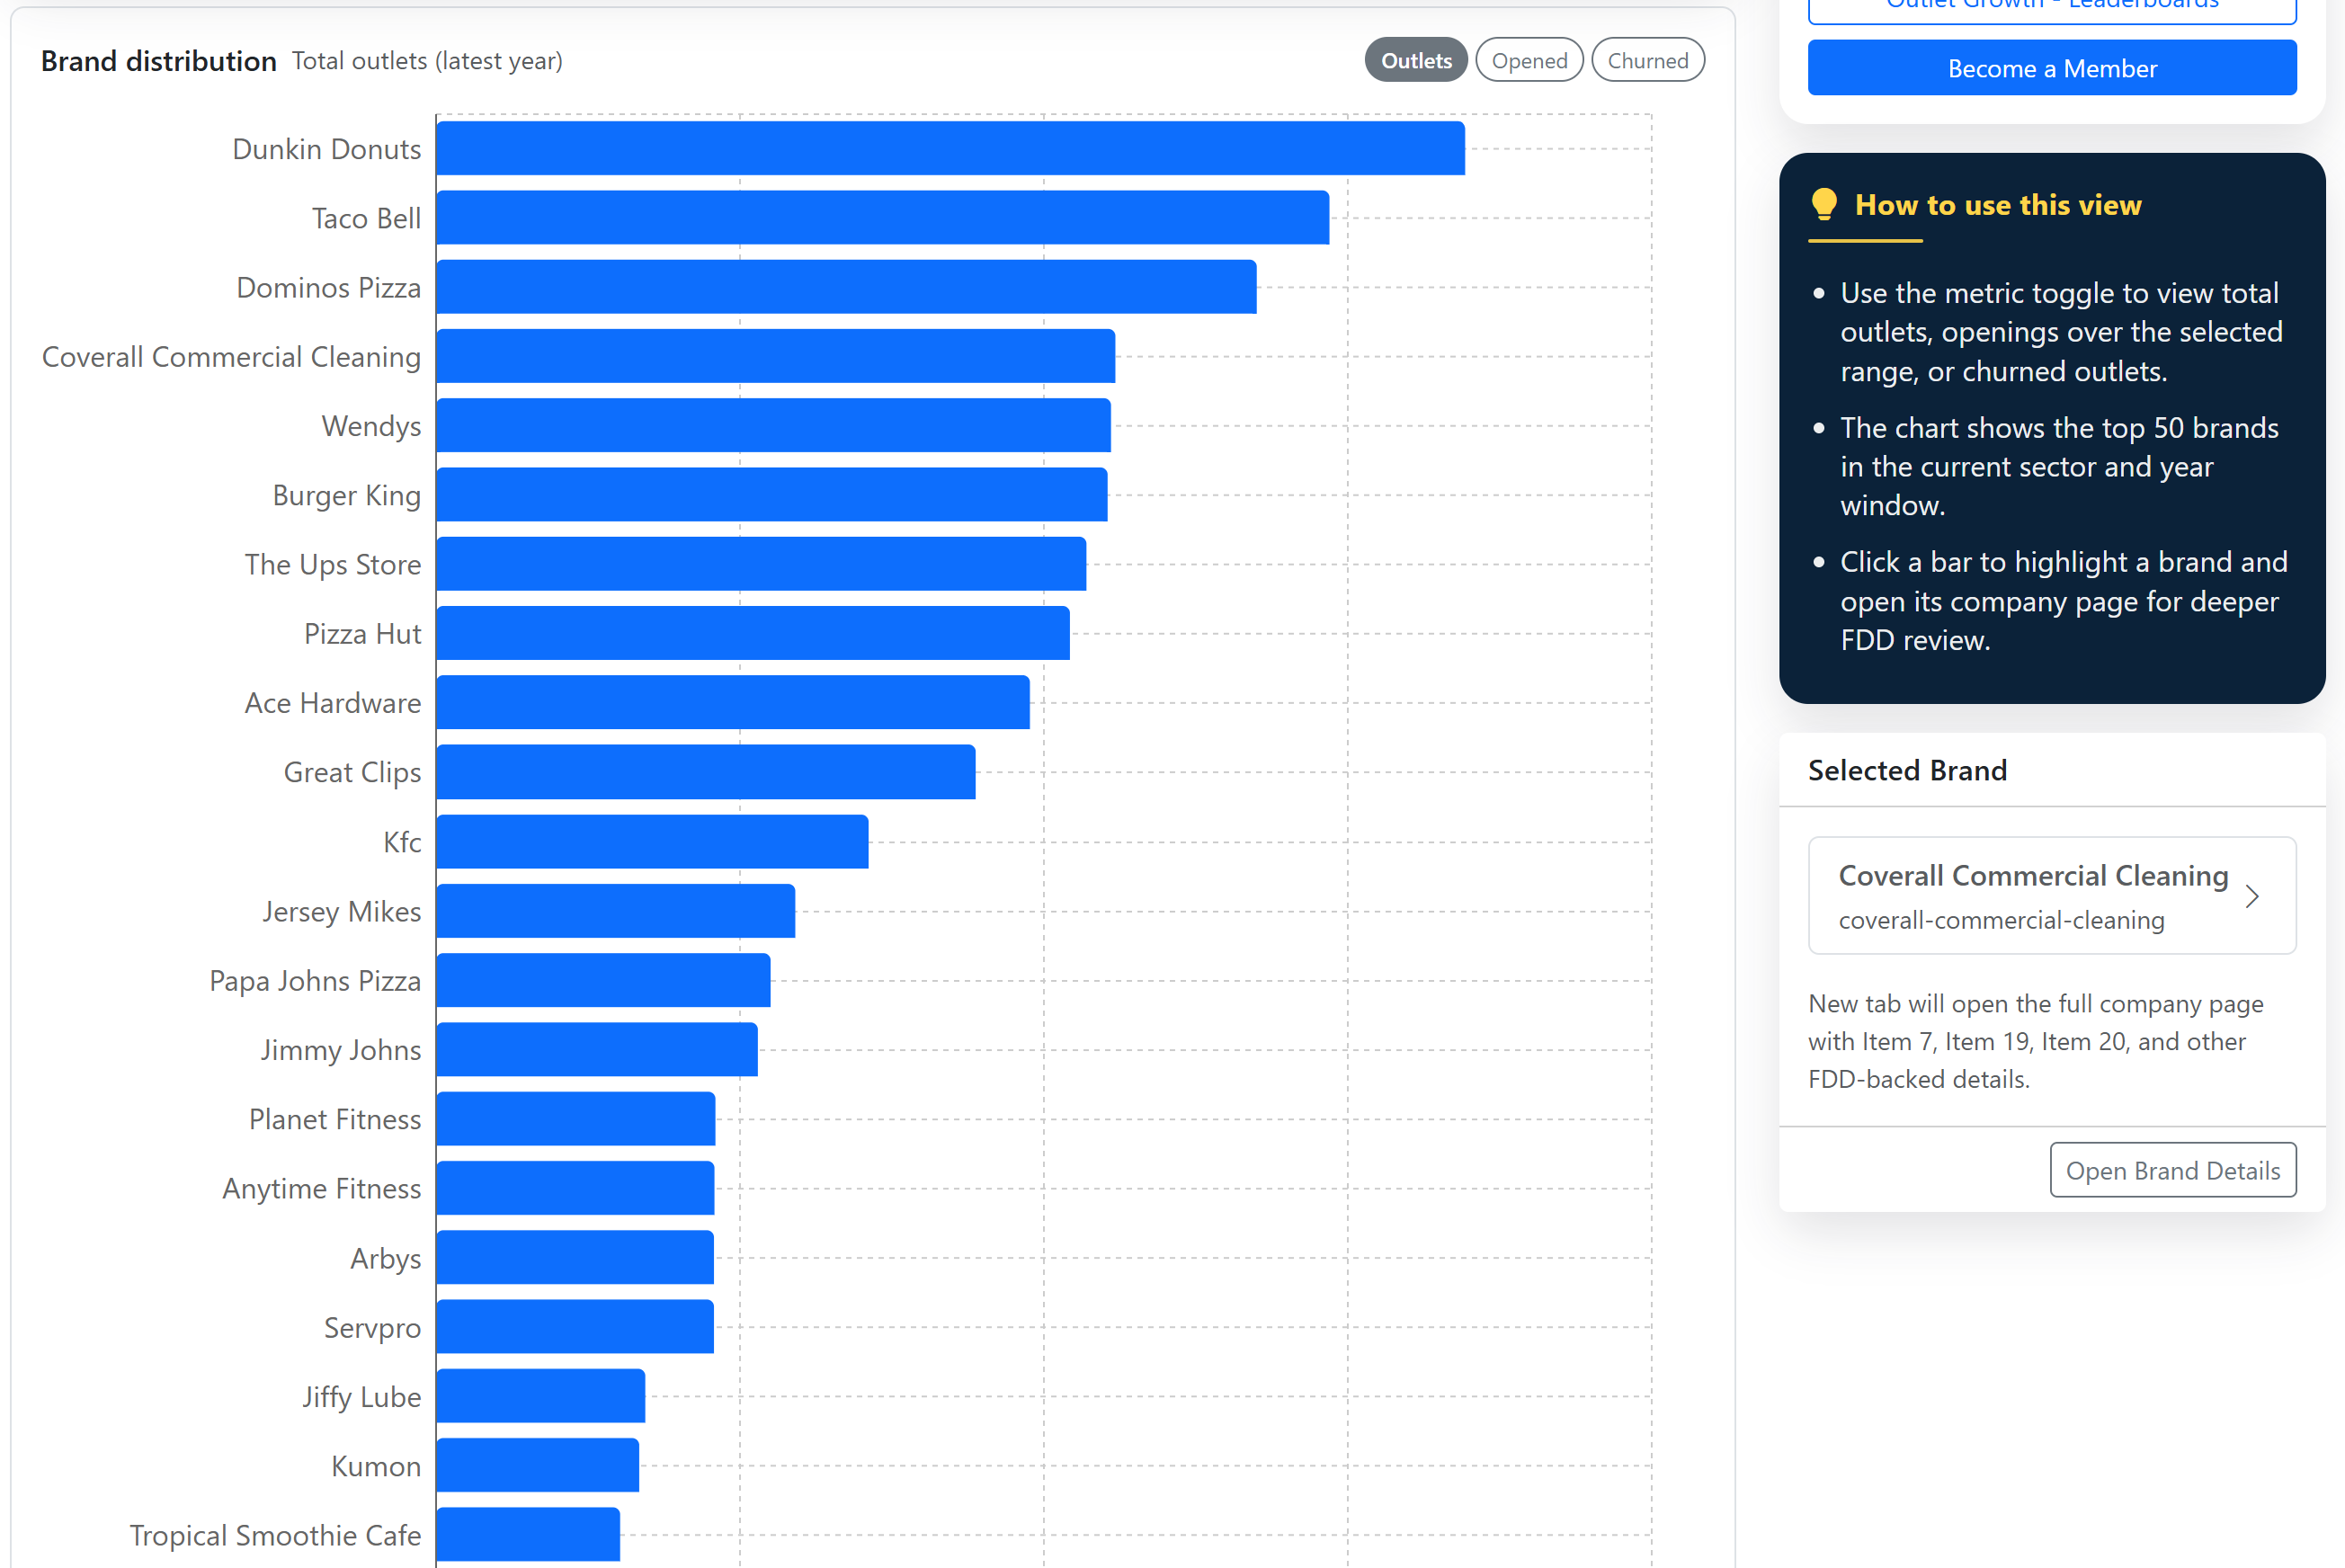
If the underlying business case still makes sense, then use the rest of this page as a diligence checklist. Review investment assumptions, ongoing fees, revenue disclosures (if any), outlet growth and churn trends, litigation or enforcement disclosures, and contract terms that affect transfer and exit.

Diligence should extend beyond documents. Understand the incentives of each person you speak with. Speak with multiple franchisees (including operators not selected or referred by the franchisor) and talk with other owners in the same industry to understand real-world performance, day-to-day challenges, and local market dynamics.

This page is not an exhaustive diligence review. Use sector benchmarking and additional research to test the brand narrative against market reality, and confirm details with the latest FDD and qualified advisors.

This page summarizes selected franchise disclosure data to support screening and comparison.

The estimated initial investment range is $480,850 - $941,300. It may also highlight fee structures, revenue disclosures when available, outlet growth history, litigation matters, and other diligence considerations.

Franchise Signal is a research and analysis tool. It is not legal, accounting, or financial advice, and it is not a complete representation of all franchise disclosures. Not every item is captured, some brands do not disclose certain information, and data can contain errors.

For a framework on how to read Franchise Disclosure Documents, including item-by-item explanations and diligence questions to discuss with counsel and advisors, see the Franchise Signal FDD Guide.

Before making any decision, read the full FDD, validate assumptions with franchisees and local operators, and consider independent market research.

Franchise brands operate inside broader market categories (for example: home services, maintenance, retail, QSR, fitness). Comparing a brand in isolation can be misleading because sector economics often drive outcomes.

Use the sector comparison snapshots and the Analytics Dashboard to benchmark Jamba against similar systems: outlet growth and contraction, churn patterns, unit size and density, and growth projections. The goal is to understand whether the brand's trajectory looks typical for its sector, or whether it is diverging in a way that warrants deeper diligence.

Sector context helps prioritize what to investigate next and which follow-up questions to bring to franchisees, lenders, and advisors.

Yes. Some decisions require more than a single-year snapshot. It can be helpful to review multiple years of disclosures and surface changes that are easy to miss when documents are reviewed one at a time.

A deeper review may include multi-year trends (growth, churn, and projections), litigation or enforcement disclosures over time, investment and fee changes year-over-year, and other signals that help focus diligence.

If you are evaluating Jamba for an acquisition, expansion, financing decision, or legal or advisory diligence, you can request a sample analysis and discuss a structured research workflow. This is designed to augment your work with attorneys and advisors, not replace it.

These are high-level research questions. Section-specific FAQs appear within each section.
Quick Actions
Franchise Directory
Book A Demo
Review your franchise diligence, analytics, or advisory workflows.
Schedule A Demo
Used by advisors, investors, and operators for screening, benchmarking, and multi-year disclosure review.
Disclosure
Franchise Signal is an independent research platform and is not affiliated with or endorsed by any franchisor or franchise system.

We do not provide lead generation and we are not brokers, agents, or investment or legal advisors.

If data looks incorrect or you have questions, please contact info@franchisesignal.com.

Investment

Estimated initial investment ranges from the Franchise Disclosure Document

Upfront Investment (Item 7)

Estimated initial investment ranges by category, shown across available years.
Food And Beverage Format Note
For food and beverage brands, Item 7 estimates are often based on a traditional restaurant format. Alternative formats like end-cap, kiosk, inline, mall, food court, or other non-traditional footprints can have meaningfully different investment requirements. Please review the Item 7 footnotes and format assumptions in the FDD before comparing brands.
Category Breakdown
Change In Total Estimated Investment:
+2.8%(2-year period)
Calculated using the midpoint of the total estimated range. Earliest year midpoint: $697,250 from $529,750 - $864,750 in 2024. Latest year midpoint: $716,900 from $505,000 - $928,800 in 2025. This shows how the estimated total upfront investment changed from 2024 to 2025.
$505,000$928,800
Category20242025
Construction and Build Out Costs$260,000 - $400,000$200,000 - $390,400
Equipment Package$142,000 - $175,000$146,300 - $180,250
Exterior Signage$6,500 - $15,800$25,500 - $62,100
Additional Funds - 3 Months$15,000 - $43,000$15,000 - $43,000
Initial Franchise Fee$35,500 - $35,500$35,500 - $35,500
Computer System$8,600 - $24,000$13,400 - $31,300
Architect/Engineer$6,200 - $19,000$13,900 - $27,000
Permitting$500 - $17,500$1,800 - $21,000
Millwork$11,300 - $17,000$9,000 - $20,500
Security Deposits$0 - $15,000$0 - $15,000
Misc. Opening Costs/Office Supplies$9,000 - $14,000$9,000 - $14,000
Menu Board, Graphics, and Interior Signage$2,100 - $10,000$2,100 - $10,300
Grand Opening Marketing$10,000 - $12,000$10,000 - $10,000
Legal and Accounting Fees$5,000 - $10,000$5,000 - $10,000
Opening Inventory$5,000 - $10,000$5,000 - $10,000
Rent$4,000 - $10,000$4,000 - $10,000
Insurance$1,550 - $8,100$1,500 - $8,100
On-Site Training Fee$0 - $6,100$0 - $6,100
Furniture$400 - $6,050$400 - $6,050
Travel and Living Expenses during Training$3,100 - $5,100$3,600 - $5,700
Smallwares$4,000 - $5,500$4,000 - $5,500
TV/Music$0 - $3,600$0 - $4,000
Management Training Program Fee$0 - $2,500$0 - $3,000
Total$529,750 - $864,750$505,000 - $928,800
FAQs

Treat Item 7 as a documented starting point, not a guaranteed budget.

Use it to build scenarios and identify where assumptions matter. Separate required costs from optional choices, and note which costs vary by location.

Then confirm the assumptions by reading the Item 7 footnotes and asking operators how their real spend differed and why.

Ask what operating model the estimate assumes and what is included versus excluded.

Confirm timing assumptions. Identify what must be paid before opening, what is paid after opening, and what depends on local requirements.

Ask for common surprise costs during the first 6 to 12 months and whether they are required by the system or driven by local conditions.

Franchise Signal can make mistakes. Always verify figures against the latest FDD.
Key Insights
  • Estimated initial investment range: $505,000 - $928,800.
  • Largest line items (by max): Construction and Build Out Costs, Equipment Package, Exterior Signage.
  • Change across years (midpoint of total range): +2.8% (2024 to 2025).
  • Food and beverage formats can change Item 7 assumptions. Confirm format details in the FDD.
  • Item 7 ranges reflect assumptions and footnotes. Read the notes before comparing brands.
  • Totals can change without category detail changing if the franchisor updates grouping or definitions.

Fees

Fees

Royalty and ad fund contributions to the franchisor, shown across available years.
Fee20242025
Royalty6% of Net Sales6% of Net Sales
Ad Fund3% of Net Sales3% of Net Sales
Values shown here are simplified for readability and may not be the exact fee for your situation. Tier schedules, minimums, and special rules may apply. Always confirm the exact fee definitions, bases, and rules in the FDD.
This is not an exhaustive list of fees. For a full list of fees and YoY delta analysis, please get in touch or refer to the FDD.
FAQs

This section surfaces only two common franchisor fees when they are available and parsed: royalty and ad fund.

Many brands have additional fees and requirements that are not shown here, including technology fees, training fees, transfer fees, audit fees, supplier requirements, and other charges.

Please refer to Items 5 and 6 in the FDD for the complete fee table and the exact definitions.

Some fees have minimum payments even when sales are low, and some use tier schedules where the percentage changes at specific thresholds.

Verify the basis, such as "gross sales," "gross revenue," or "net sales." Two brands can list the same headline percentage but apply it differently.

Always confirm when the fee starts, whether any temporary reductions apply, and how the fee is calculated in the FDD.

Franchise Signal can make mistakes. Always verify presented figures against the latest FDD.
Key Insights
  • Royalty (latest): 6% of Net Sales.
  • Ad fund (latest): 3% of Net Sales.
  • These are franchisor fees only. They do not represent a full operating budget or pro forma.
  • Always confirm the exact fee definitions and rules in Items 5 and 6 of the FDD.

Revenue and Financial Performance

Item 19 representations and disclosures (if provided) and how to interpret the sample.
Revenue (Item 19)
Franchise Signal pulls Item 19 revenue figures for Food and Beverage brands as annual gross sales per unit when possible. Many franchisors limit tables to specific subsets (mature stores, franchised only, company-owned only, or top performers). Pay close attention to which units are included and how revenue is defined. Confirm the definitions in the FDD before comparing across brands.

No aggregate revenue figures are shown for this brand's Item 19. This can happen when:

  • The franchisor does not disclose any Item 19 financial performance representations.
  • The Item 19 data is per-unit, per-customer, or non-total metrics that cannot be normalized.
  • The franchisor includes projections, examples, or scenarios rather than actual totals.
  • Franchise Signal had trouble parsing the relevant data from the FDD.

Always review Item 19 carefully: sample size, time in business, exclusions, and definitions. Use AI chat as a follow-up tool, not the primary source.


FAQs

Item 19 tables often assume a specific unit definition, such as a single outlet, a protected territory, a trade area, or a defined service region.

Before comparing numbers, confirm what a unit represents for this brand and whether results are segmented by territory size, market type, or maturity.

Also check whether the disclosure mixes franchised and company-owned units, or separates them into different tables.

Item 19 disclosures rarely include every unit. Many franchisors limit the sample to outlets open for a minimum period, units with complete reporting, or a specific subset of locations.

Units may be excluded due to being newly opened, temporarily closed, transferred mid-year, non-traditional formats, or because the franchisor does not collect uniform data from all operators.

When a sample is smaller than expected, treat the figures as directional and focus on the inclusion rules, the time period covered, and how revenue is defined.

Key Insights
  • No normalized revenue figures were captured for this Item 19.
  • This may mean there is no Item 19, or the data is non-comparable (per-unit, scenarios, projections).
  • Read Item 19 carefully: sample size, time in business, exclusions, and definitions matter.
  • Use AI chat as a follow-up tool, not as the primary source.

System Growth and Stability

Outlet openings, closures, and churn signals (Item 20 Table 3).
Outlet Growth (Item 20)
Outlet counts shown here reflect franchised outlets only, not affiliate or company-owned locations. Some FDDs report these categories separately; always review the Item 20 tables and footnotes to confirm how each type of outlet is classified.
Outlets (latest): 726
Net Growth:
-4.7%(4-year period)
Calculated as (726 latest-year ending outlets - 762 earliest-year starting outlets) / 762. This measures overall franchised outlet growth from 2021 through 2024.
Churn:
+20.7%(4-year period)
Calculated as (158 total terminations + 0 total ceased operations) / 762 earliest-year starting outlets. This measures cumulative exit activity relative to the starting system size from 2021 through 2024.
YearStartOpenedTerminationsNonrenewalsReacquiredCeasedEndNet
20217622843000747-15
20227472941000735-12
20237353228600733-2
20247334246300726-7

FAQs

Churn is the rate of operator exits over time. It can reflect unit economics, operational difficulty, market saturation, or franchisor enforcement, depending on the system.

Even when net outlet counts grow, elevated churn can mean more operators are cycling in and out. That can affect brand stability, support load, and the predictability of outcomes.

Use churn as a signal to investigate, not as a verdict. Confirm definitions in the Item 20 footnotes before comparing brands.

Key Insights
  • Terminations and nonrenewals are not the same. Terminations are forced exits. Nonrenewals are an end-of-term outcome.
  • Ceased operations can include closures, transfers out, or other status changes. Read the footnotes for definitions.
  • Reacquired and transfers can make net growth look healthy while hiding churn. Track openings vs exits, not just net.

Litigation Matters

Litigation disclosures, presented neutrally.
Litigation Matters (Item 3)
This section summarizes Item 3 matters disclosed in the FDD. Summaries are simplified for readability and may omit context. Always confirm details in the full Item 3 disclosure and underlying filings when possible.
Latest year
2025
Matters (latest year)
3
Open vs resolved
0 open, 3 resolved
Counts are a starting point. Expand a matter to review allegations, outcomes, and parties.
2025 Disclosures
The People of the State of California v. Arby's Restaurant Group, Inc.
litigationCaliforniasettled
The People of the State of California v. Dunkin' Brands, Inc.
litigationCaliforniaclosed
New York v. Dunkin' Brands, Inc.
consent_orderNew Yorkconsent_order
2024 Disclosures
The People of the State of California v. Arby's Restaurant Group, Inc.
consent_orderCaliforniaconsent_order
The People of the State of California v. Dunkin' Brands, Inc.
consent_orderCaliforniaclosed
New York v. Dunkin' Brands, Inc.
consent_orderNew Yorkconsent_order
FAQs

Item 3 lists certain legal actions involving the franchisor and related parties, as defined by the franchise disclosure rules.

A listing can be a diligence signal about dispute types or regulatory attention, but it does not establish liability or wrongdoing by itself.

Interpret each matter by reading the allegations, outcome, parties, and the underlying definitions and footnotes in the FDD.

Litigation listings are not proof of wrongdoing. Use them to guide diligence and verify details.
Key Insights
  • Matters in latest FDD year (2025): 3.
  • Latest year mix: 0 open, 3 resolved.
  • Item 3 disclosures are summarized and may omit context. Read underlying filings and FDD footnotes.
  • Do not assume liability or wrongdoing from a matter listing. Treat as a diligence signal.

FAQs

Additional questions to consider in diligence.
Other Key Items

These questions highlight common diligence topics beyond financial performance. Exact terms vary by brand and can change by agreement version. Always confirm details in the latest FDD and the full franchise agreement.

FAQs

Some agreements require payments after termination, nonrenewal, or closure, such as a fixed damages amount or royalties for a future period.

Confirm what triggers the obligation, how the amount is calculated, and whether it varies by cause. Review any cure periods, offsets, or exceptions.

Always verify the exact language in the franchise agreement and related exhibits.

Territory definitions vary. They may use zip codes, a radius, population, or a list of approved sites. Some systems provide limited or no exclusivity.

Confirm whether the franchisor or other franchisees can sell into your area through alternative channels, online leads, national accounts, or new formats.

Ask what happens if the brand adds new products or services that overlap your market.

Use this page for screening, then read the full FDD and the franchise agreement end to end.

Talk to multiple current and former franchisees, including operators not selected by the franchisor, and speak with other owners in the same industry to compare unit economics and operational realities.

Bring questions to independent advisors, including a franchise attorney and an accountant, and confirm assumptions with local market research.

These are general diligence questions. Verify all terms in the latest FDD and the franchise agreement.
Key Insights
  • Every franchise system is different. Do not assume terms are standard across brands.
  • Talk to multiple current and former franchisees, not just referrals provided by the franchisor.
  • Compare agreement terms to other operators in the same industry to calibrate what is normal.
  • Verify everything in the latest FDD and the full franchise agreement. Summaries can omit context.
  • Ask for plain language explanations of renewal, termination, transfer, and dispute resolution before signing.